The Best Crypto Analytics Dashboards that equip traders and investors with sophisticated insights derived from blockchain data, market trends, and on-chain activity. By converting intricate data sets into manageable, actionable analytics, these platforms empower users to align strategy with observable market realities.
Featuring capabilities such as bespoke charting, contemporaneous and historical market overlays, and AI-enhanced forecasting, the most effective dashboards are indispensable for purposeful navigation of contemporary cryptocurrency environments.
Key Point & Best Crypto Analytics Dashboards List
| Tool | Key Point |
|---|---|
| Dune Analytics | Community-driven platform for custom blockchain data dashboards using SQL queries. |
| DefiLlama | Tracks DeFi protocols with real-time TVL (Total Value Locked) and yield data. |
| Token Terminal | Provides financial metrics for crypto projects, like revenue and P/E ratios. |
| Glassnode | On-chain analytics focused on Bitcoin and Ethereum, offering network health insights. |
| CryptoQuant | Exchange and miner data analytics, helpful for tracking inflows/outflows. |
| Nansen | Wallet and smart money tracking with strong NFT and DeFi portfolio analysis. |
| Santiment | Social and on-chain sentiment analytics, combining crowd psychology with data. |
| Messari | Research-driven platform offering project insights, news, and detailed reports. |
| IntoTheBlock | AI-based analytics covering on-chain data, indicators, and market predictions. |
| TradingView | Advanced charting and technical analysis platform widely used across markets. |
1. Dune Analytics
Dune Analytics distinguishes itself among premier cryptocurrency analytical platforms by enabling users to build bespoke blockchain insights through uncomplicated SQL statements.
Rather than functioning within rigid, predetermined panels, the platform offers total autonomy, permitting novices and seasoned analysts alike to convert unprocessed on-chain data into bespoke visualizations and reports.
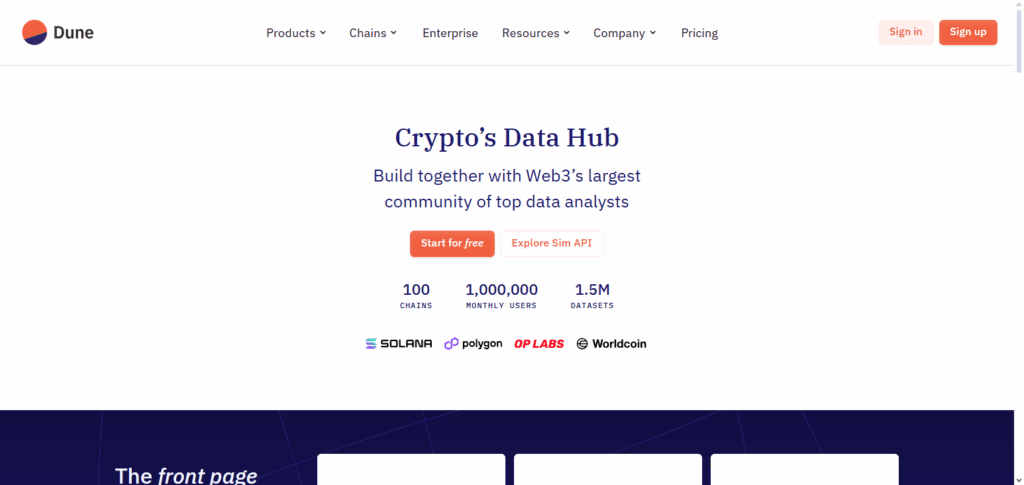
The combination of an open, community-oriented model and a continually expanding gallery of community-contributed dashboards cultivates a collaborative, transparent environment in which intricate blockchain inquiries can be advanced, collectively critiqued, and revisited—and where analysts are liberated from inheritance by conventional predefined indicators.
Dune Analytics Features
- Platform is fueled by the community, permitting user-made queries.
- Blockchain records available on real-time dashboards driven by SQL.
- Files, Images, Rolodex formats for visual data representation.
- Free and paid versions with tiering for more advanced queries.
- Ethereum, Polygon, Optimism, Arbitrum, BNB Chain and more available.
Pros & Cons Dune Analytics
Pros:
- Custom SQL queries enable precise on-chain data interrogation.
- Vibrant community shares reusable dashboards and query templates.
- No-cost tier gives broad access without upfront investment.
Cons:
- Advanced analysis depends on SQL proficiency.
- Real-time data latency is pronounced outside of the premium tier.
- Free tier’s responsiveness drops during network peaks.
2. DefiLlama
DefiLlama has established itself as a leading crypto analytics dashboard, celebrated for its unparalleled transparency in monitoring decentralized finance (DeFi) protocols across diverse blockchain networks.
The platform’s preeminent advantage is the provision of real-time Total Value Locked (TVL) figures, free of any subscription or payment requirements, thereby guaranteeing unrestricted access to every visitor.
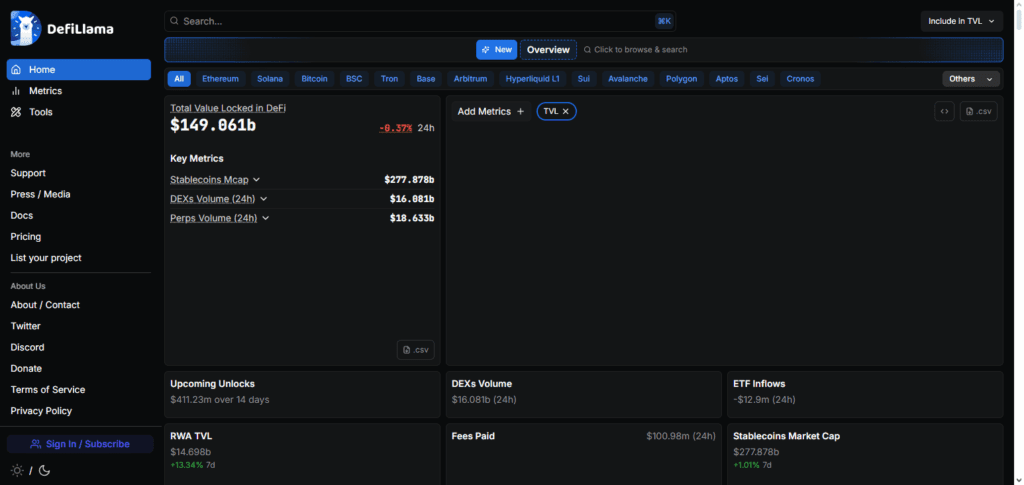
In contrast to the prevailing model among competing services, DefiLlama retrieves its information directly from on-chain smart contracts, thereby greatly diminishing the friction and potential distortion of third-party intermediaries.
The consequence is a verifiable, immutable foundation for analysing yield conditions, comparing protocols, and deriving insights from cross-chain ecosystems, all of which equips users with precise, impartial analytics on which strategic decisions can reliably be built.
DeFiLlama Features
- All aspects of DeFi and TVL analytics.
- Lending, staking, yield farming, and DEX protocols.
- 100+ Blockchain multi-chain protocols.
- Revenue dashboards for certain protocols.
- Stablecoin supply and bridge flow data.
Pros & Cons DefiLlama
Pros:
- Dominant platform for DeFi, displaying TVL and yield across protocols.
- Entirely free and open-source, guaranteeing data transparency.
- Cross-chain support aggregates disparate ecosystems.
Cons:
- Centralized exchange metrics receive minimal attention.
- Wallet-level analysis is shallow or absent.
- Interface offers basic layouts, limiting customization.
3. Token Terminal
Token Terminal distinguishes itself among leading cryptocurrency analytics dashboards by integrating traditional financial metrics with on-chain data.
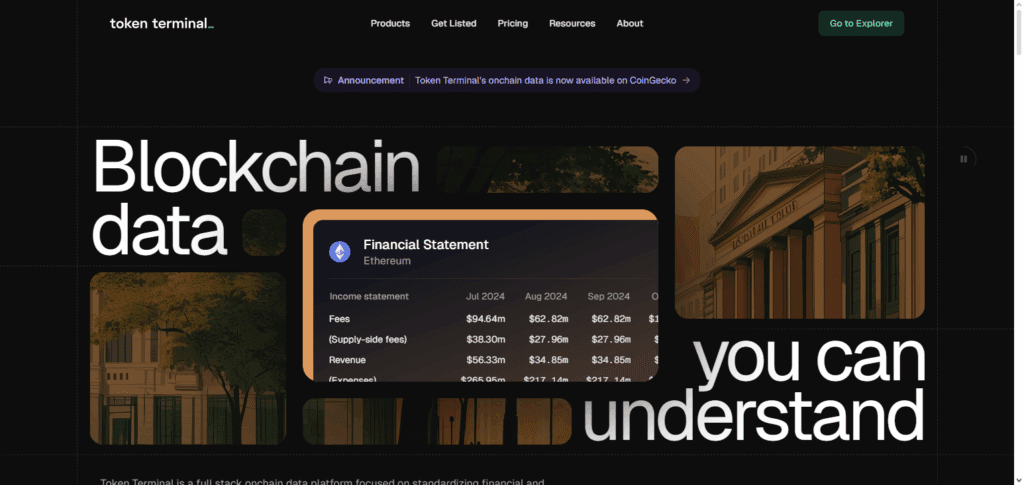
Its defining advantage lies in the presentation of network performance indicators that parallel conventional equity analysis, encompassing revenue figures, earnings multiples, and active-user statistics.
Consequently, the platform permits market participants to appraise decentralized protocols under the same methodological discipline ordinarily reserved for publicly traded corporations, thereby enhancing the precision of investment assessments.
By encoding blockchain outcomes within recognized valuation lexicons, Token Terminal renders cryptocurrency due diligence both transparent and methodically coherent.
Token Terminal Features
- Financial analytics for crypto projects, and equity-style metrics.
- Revenue, fees, valuation ratio tracking.
- Data for investors, analysts, and researchers.
- Like what the stock market financial terminals do.
- Developer activity, protocol fundamentals.
Pros & Cons Token Terminal
Pros:
- Metrics mimic traditional finance, e.g., P/E and adjusted cash flow.
- Peer comparison is straightforward, using equity-like dashboards.
- Institutional-grade data curated for due diligence.
Cons:
- Advanced metrics each require premium subscription.
- Retails users face a steeper learning curve and cost.
- Community tools and templates are limited relative to larger networks.
4. Glassnode
Glassnode is recognized as one of the foremost crypto analytics dashboards primarily because it centers on sophisticated on-chain intelligence that extends well beyond superficial market indicators.
Its distinctive capability resides in the systematic examination of wallet activity, liquidity transitions, and broader network dynamics to surface emergent market patterns ahead of consensus.
Through meticulous monitoring of long-term holder behaviour, exchange inflows, and supply-side mechanics, the platform equips users to gauge the early contours of sentiment and to map impending cyclical transitions.
This comprehensive, behaviour-centric methodology renders the service indispensable for both traders and investors who demand forward-looking blockchain analytics grounded in verifiable on-chain data.
Glassnode Features
- Market intelligence and on-chain data service
- Supply, UTXO, addresses, Ethereum, and Bitcoin network metrics.
- Sophisticated Graph with Overlays and Custom Charts.
- Alerts on activity shifts on the blockchain.
Pros & Cons Glassnode
Pros:
- Comprehensive on-chain metrics specially curated for Bitcoin and Ethereum.
- Visually layered charts convey complex data intuitively.
- Extensive historical databases support academic and professional research.
Cons:
- Full access fee remains among the highest in the sector.
- Service coverage for emerging altcoins remains narrow.
- Novice users may be challenged by intricate charting features.
5.CryptoQuant
CryptoQuant secures its status among leading cryptocurrency analytics dashboards by zeroing in on on-chain exchange and miner information that materially affects market liquidity and price deviations.
Its differentiated proposition lies in the continuous surveillance of exchange inflows and outflows, thus enabling traders to identify the onset of either aggressive sell or stealth accumulation strategies prior to their manifestation on conventional price charts.
The platform further aggregates miner operational metrics, stablecoin treasury positions, and prevailing market sentiment indices to generate empirically grounded signals.
The cumulative output of these analytic vectors confers a robust toolkit for refined risk governance and the forecasting of impending, short-duration market perturbations.
CryptoQuant Features
- Market and on-chain analytics for Bitcoin and other Altcoins.
- Captures asset inflows and outflows for whale activity.
- Market sentiment via miner and stablecoin statistics.
- User-defined alerts through Slack and Telegram.
- Market commentary for scalpers and swing traders.
Pros & Cons CryptoQuant
Pros:
- Specialized in monitoring exchange inflows and outflows in real time.
- Customizable alerts help detect significant whale transactions.
- Generates short-term trading signals based on order-book dynamics.
Cons:
- Clients must subscribe to access the full suite of tools.
- Analysis remains largely centered around Bitcoin and Ethereum.
- Alert volume may overwhelm users with excessive notifications.
6. Nansen
Nansen is widely acknowledged as among the preeminent cryptocurrency analytic dashboards, owing to its sophisticated wallet intelligence and smart-money tracking capabilities that outperform most competing platforms.
Its distinctive advantage derives from the systematic labeling of millions of blockchain wallets, enabling users to trace the activities of institutional investors, whale participants, and engaged DeFi actors.
By integrating on-chain transaction data with configurable real-time alerts and detailed NFT metrics, Nansen furnishes the additional clarity necessary to discern latent market opportunities at an early stage.
This fundamentally wallet-centered methodology renders Nansen an indispensable resource for disciplined trading and astute portfolio management.
Nansen Features
- Crypto wallet analytics with blockchain wallet tagging (“smart money” tracking).
- VCs, whale, and institutional wallet detections.
- NFT marketplace activity and trend analytics.
- Tracker for wallets and address portfolios.
- Whale token and liquidity metrics.
Pros & Cons Nansen
Pros:
- Wallet labeling visualizes key whale movements by counterparty.
- Delivers in-depth NFT and DeFi transaction analytics.
- Polished interface features layered customizable dashboards.
Cons:
- Advanced tiers command a premium price.
- Beginner users report steep learning curves due to data density.
- Very limited functionality without a paid account.
7. Santiment
Santiment distinguishes itself among leading cryptocurrency analytics platforms by integrating on-chain metrics with behavioral finance techniques, thus furnishing a comprehensive market appraisal that transcends traditional data sources.
The platform excels in assessing social sentiment, developer activity, and token mobility, synthesising these dimensions to reveal latent indicators of prospective price inflection.
Through its dual-focus methodology, Santiment exposes early manifestations of speculative surges, panic-induced liquidations, or robust grassroots adoption, enabling users to anticipate sentiment-driven price oscillations with greater precision.
Such insights render the platform a formidable resource for strategic positioning in the inherently volatile cryptocurrency ecosystem.
Santiment Features
- On-chain and social metrics for crypto assets.
- Social sentiment from Twitter, Reddit, and Telegram.
- Developer activity metrics, token circulation, and MVRV.
- Behavioral analytics for predicting market movements.
Pros & Cons Santiment
Pros:
- Innovative sentiment and social-volume analytics correlate price cycles.
- Tracks development activity among a broad selection of chains.
- Economical access tier provides a strong feature set for the price.
Cons:
- UI lacks the modern polish found on many rival platforms.
- Advanced indicators require a higher subscription tier.
- Analytics for NFT and DeFi activity remain peripheral.
8. Messari
Messari is widely acknowledged as among the foremost crypto-analytics dashboards due to its capacity to furnish contextualized metrics alongside extensive data sets.
Rather than confining itself to price charts and transaction volumes, the platform integrates live market statistics with detailed research papers, timely news digests, and systematic governance monitoring.
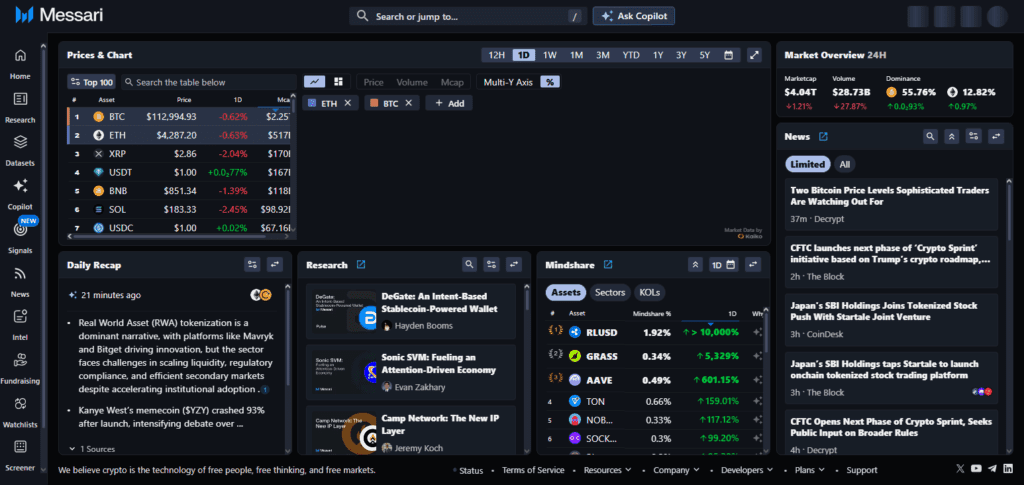
This dual architecture transforms Messari from a merely quantitative platform into a comprehensive intelligence repository that illuminates the wider digital-asset ecosystem.
The simultaneous availability of sophisticated quantitative tools and rigorous qualitative analysis allows users to appraise potential investments with a conferral of empirical confidence, thereby facilitating judicious, strategically sound choices anchored in multidisciplinary evidence.
Messari Features
- Analytics on Research for digital assets.
- Crypto Governance, profiles, and fundamentals trackers.
- Tokens metrics comparison screening.
- Crypto assets and pioneering research for institutions.
- Coverage on regulations and governance.
Pros & Cons Messari
Pros:
- Delivers rigorously researched reports alongside quantitative data.
- Adaptive dashboard offers customizable watchlists and widgets.
- Widely regarded within the institutional investment community.
Cons:
- Premium access tier is among the costliest on the market.
- Several metrics overlap with data available on free platforms.
- Advanced DeFi analysis is not as comprehensive as dedicated competitors.
9. IntoTheBlock
IntoTheBlock ranks among the premier cryptocurrency analytics platforms owing to its deployment of AI-enhanced methodologies that yield actionable insights spanning diverse levels of blockchain information.
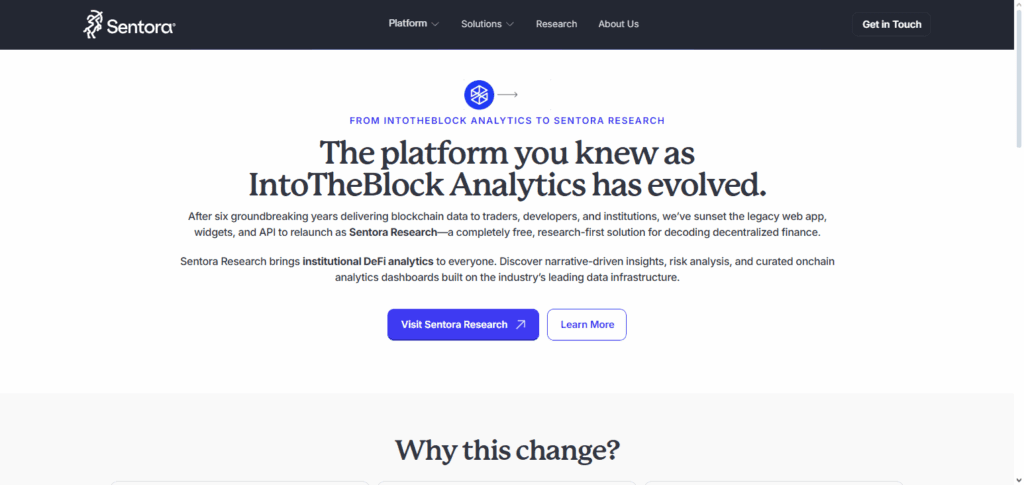
What distinguishes the service is its capacity to distill intricate metrics—such as the concentration of large wallet holders, transactional participant profiles, and prevailing market signals—into intuitively interpretable indicators.
By marrying on-chain observations with predictive algorithms, the dashboard equips market participants to evaluate prevailing sentiment and anticipated price trajectories with pronounced precision.
This integration of advanced analytics and underlying blockchain data renders the platform indispensable for strategic, anticipatory decision-making.
Into The Block Features
- Analytical features and tools focused on specific crypto projects.
- Indicators provided and their parameters (ex. “In/Out of the Money” and “Owership Concentration”)
- On-chain signals and exchange flows and derivatives data.
- Market sentiment, whale analysis.
Pros & Cons Into The Block
Pros:
- Artificial intelligence-powered algorithms synthesise on-chain dimensions.
- Indicators balance retail and institutional focal points, broadening applicability.
- Competitive pricing relative to platforms like Glassnode and Nansen.
Cons:
- Coverage is sparse for less prominent altcoins.
- Analytical documentation may be dense and technical.
- Limited number of user-generated dashboard templates.
10. TradingView
TradingView has emerged as a premier Crypto Analytics Dashboard, distinguished by sophisticated charting and analytical capabilities widely adopted by both retail and institutional market participants.
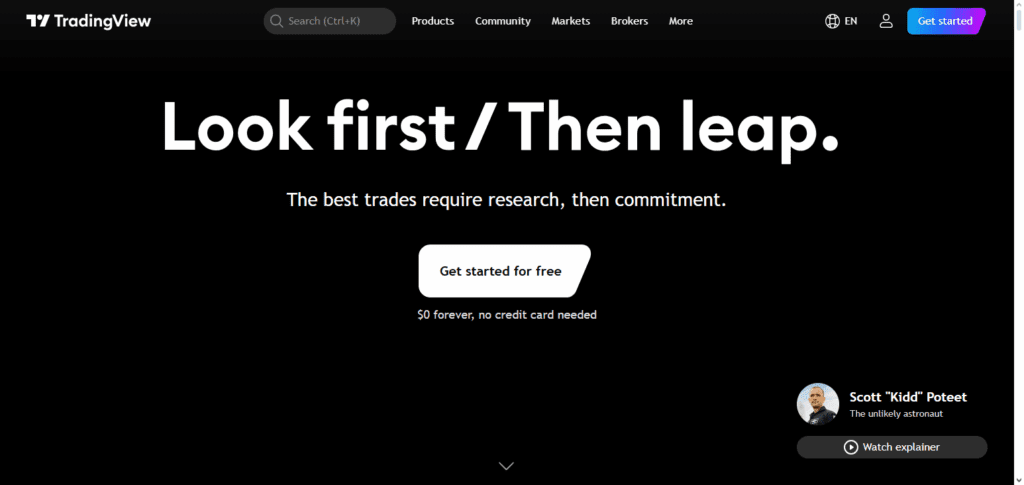
The platform’s defining advantage resides in its ability to merge highly customizable technical indicators with a large and active social network, enabling the instantaneous exchange of trading ideas and market observations.
Beyond standard candlestick displays, TradingView aggregates cryptocurrency, foreign exchange, and equities data within a unified visual workspace, thus facilitating comparative market studies.
Such breadth of coverage positions the platform as a critical center for informing technical trading judgments across asset classes.
TradingView Features
- Most popular for charting and trading.
- Comprehensive libraries of technical analysis, advanced indicators, and drawing tools.
- Multimarket access: stocks, forex, crypto, and commodities.
- Shareable charts in a proprietary online trading community.
- Custom alerts, strategy builder using Pine Script.
Pros & Cons TradingView
Pros:
- Widely recognized charting engine across multiple asset classes.
- Synchronizes technical analysis across crypto and traditional globals.
- Extensive user base contributing thousands of customizable scripts.
Cons:
- Data ingestion is mediated through exchange APIs; does not natively track crypto on-chain.
- On-chain metrics are not provided.
- Accessing advanced charting and indicator features necessitates a premium subscription.
Conclusion
To summarize, leading cryptocurrency analytics dashboards furnish traders, institutional investors, and academic researchers alike with enhanced visibility of on-chain dynamics, market psychology, and emergent sentiment patterns.
Solutions such as Dune Analytics, DefiLlama, Token Terminal, Glassnode, CryptoQuant, Nansen, Santiment, Messari, IntoTheBlock, and TradingView each possess distinctive competitive advantages—from highly customizable dataviz layers to machine learning forecasts and wallet taxonomy.
By systematically applying these infrastructures, market practitioners can convert unstructured on-chain records into precise tactical frameworks, thereby sharpening judgment and moderating exposure amid the hyper-dynamic cryptocurrency landscape.
FAQ
Crypto analytics dashboards are platforms that provide on-chain, market, and sentiment data, helping traders and investors analyze blockchain activity and price trends.
DefiLlama and Dune Analytics are popular free options, offering open access to DeFi and on-chain insights without subscription costs.
They help users track network activity, identify whale movements, evaluate project fundamentals, and make informed trading or investment decisions.