In the fast-moving and dynamic cryptocurrency industry, the right tools can make the difference between success and opportunity loss. Best Crypto Charts to Use assist traders and investors in visualizing price movements, tracking market changes, and making confident decisions based on data.
These charts provide users with the necessary understanding of the market, whether they are novices or professionals looking for in-depth analysis. With the right tools supporting them, users can experience a significant reduction in stress while navigating the crypto market.
What are crypto charts?
Crypto charts comprise instruments depicting the movements of a cryptocurrency’s price, trading volume, and changes in the market across different time intervals. These instruments are helpful for traders and investors in determining the historical performance of particular coins and tokens, paving the way for them to anticipate future performance.
Line charts, which depict price trends in simplified forms, candlestick charts, bar charts representing market volatility, and depth charts portraying the market’s buy and sell dimensions are the more prominent of the multiple types of charts.
Users of crypto charts can recognize patterns, enabling them to make rational trade decisions and analyze market behavior.
10 Best Crypto Charts to Use for Accurate Market Analysis in 2025
- TradingView – Highly customizable charts with multiple indicators and drawing tools for professional technical analysis.
- CoinGecko Charts – Offers historical price charts, market cap, and volume trends for thousands of cryptocurrencies.
- CoinMarketCap Charts – Visualizes price trends, trading volume, and historical performance across exchanges.
- CryptoCompare – Provides interactive charts with detailed metrics like order book and trading volume.
- Binance Charts – Integrated advanced charting tools directly on the Binance exchange for real-time trading analysis.
- Kraken Charts – Features candlestick charts with overlays, indicators, and trading pairs for precise tracking.
- Coinigy – Aggregates charts from multiple exchanges, supporting advanced analysis and portfolio tracking.
- Messari – Offers detailed charts with market data, metrics, and on-chain analytics.
- Delta App Charts – Mobile-friendly charts with real-time price tracking and portfolio integration.
- LiveCoinWatch – Provides interactive charts with historical data, trends, and customizable indicators.
1. TradingView – Best Crypto Charts to Use
TradingView has become a favorite among traders and analysts alike. For every user, TradingView offers fully customizable charts. They provide charts with line, candlestick, bar, and Heikin-Ashi types. Users can utilize hundreds of technical indicators, drawing instruments, and scripts to analyze movements and trends.

TradingView terminal includes real-time prices of many cryptocurrencies from a number of exchanges, such as Binance, Coinbase, and Kraken. There’s a mobile app for iPhones and Androids, which allows for constant monitoring and on-the-go trading.
Charts contain volume indicators, overlays, trend lines, and pattern recognition. TradingView’s broker integration allows trading to be done directly from the charts. These traits as well as many more make TradingView one of the Best Crypto Charts to Use.
TradingView Key Points
- Cost: Free/Paid (14.95−14.95−59.95/month)
- Mobile Application: Yes, on IOS and Android.
- Supported Markets: Cryptocurrency, Stock, Forex, and Commodities.
- Supported Exchanges: Binance, Coinbase, Kraken, Bitfinex, and others.
- Types of Charts: Line, Candlestick, OHLC, and Heikin-Ashi.
- Pros: Offers easy customization, supports multiple markets, features advanced scripting, and includes backtesting.
- Cons: Full features are only available in paid plans; complexity can be an issue for new users.
2. CoinGecko Charts
CoinGecko Charts offers insights into the price and market trends for over 10,000 different cryptocurrencies. There are candlestick, basic line, and bar charts for price, trading volume, and market cap. Digital and mobile apps on iOS and Android enable real-time price monitoring and portfolio management.
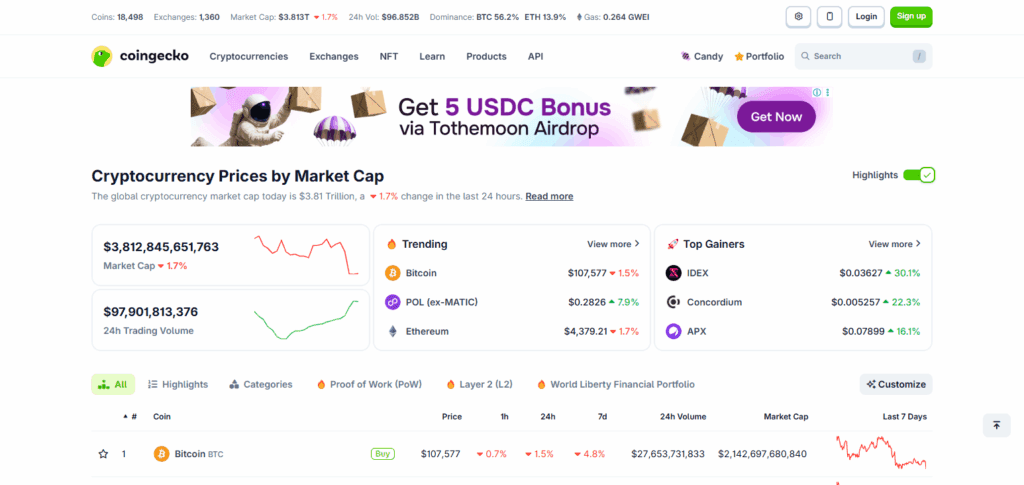
CoinGecko draws on liquidity and price data from hundreds of exchanges globally, providing accurate data and insights. Charts can show historical trends as well as moving averages and percent changes over designated contiguous time periods. Moving averages and period volatility also track.
CoinGecko provides the market’s circulating and all-time highs, dominance, and supply for the users as well. It is also easy to use and reliable, making it one of the Best Crypto Charts to use for beginners and professionals alike.
CoinGecko Charts Key points
- Cost: Free.
- Mobile Application: Yes, IOS and Android supported.
- Supported Markets: Cryptocurrency only.
- Supported Exchanges: 500+ exchanges.
- Types of Charts: Line, Candlestick, and Bar.
- Pros: Offers comprehensive historical data, mobile-friendliness, and market cap insights.
- Cons: Advanced indicators are lacking; mostly crypto-focused.
3. CoinMarketCap Charts
Cryptocurrency investors utilize CoinMarketCap Charts to analyze and observe trends in price, trading volume, and market capitalization over a period of time. Examples of formats for the charts include line, candlestick, and bar. The timeframes can be as granular as minutes and as expansive as years.
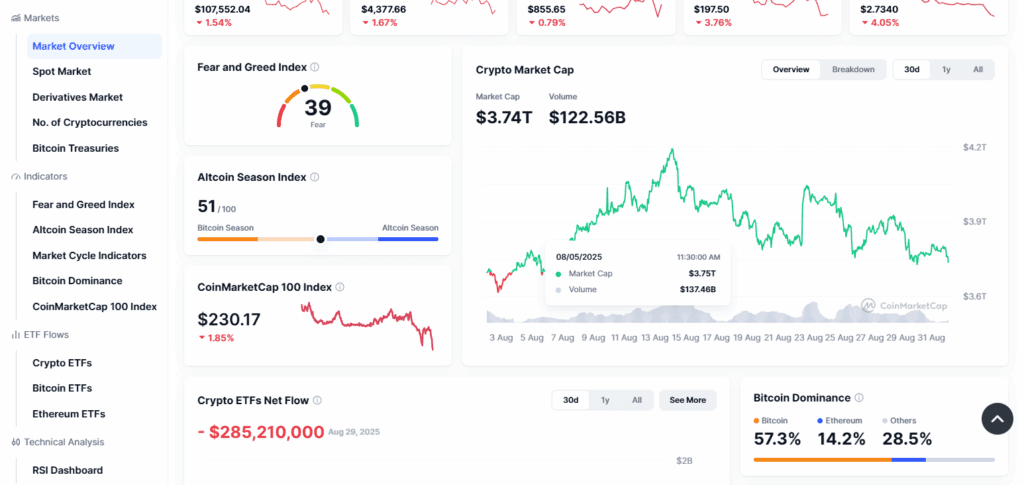
Users can pull their data from hundreds of supported exchanges worldwide, including Binance, Kraken, and Coinbase. The website offers a mobile application for iOS and Android platforms, allowing users to track prices, receive alerts, and manage their portfolios.
Users also have access to advanced metrics such as dominance, liquidity, and historical highest and lowest prices. The CoinMarketCap Charts are designed to be quite intuitive and simple to understand. Thus, they remain some of the Best Crypto Charts to Use.
CoinMarketCap Charts Key Points
- Cost: Free.
- Mobile Application: Attached to IOS and Android.
- Supported Markets: Cryptocurrency only.
- Supported Exchanges: 300+ exchanges.
- Types of Charts: Line, Candlestick, and Bar.
- Pros: Offers an easy-to-use historical trends interface and price alerts.
- Cons: Lacks advanced technical tools.
4. CryptoCompare
CryptoCompare’s unique selling point is its editable and comprehensive crypto charts, which track the price, volume, and market cap changes of thousands of cryptocurrencies. Users can customize candlestick, line or OHLC charts, and add technical indicators for enhanced analysis.
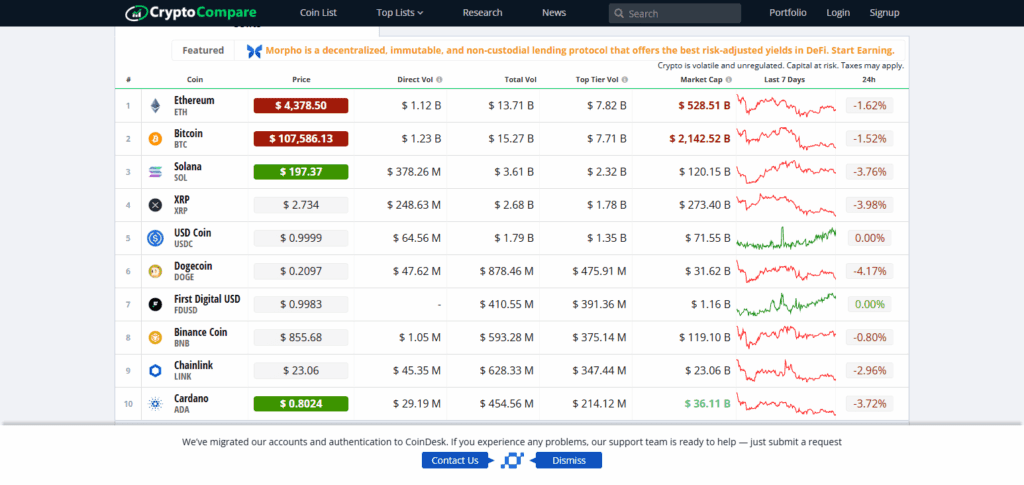
CryptoCompare is compatible with API data from the most relevant exchanges, such as Binance, Kraken, and Bitfinex, which is essential to monitor the active market. While the web is the primary venue for most of the features, CryptoCompare mobile is also designed to be user-friendly.
Users can investigate historical performance, price shifts, and on-chain metrics, as well as analyze user-defined patterns. The portfolio tracking and watchlist features also add value. CryptoCompare is packed with real-time data, customizable charts, and support for multiple exchanges ,which makes it suitable for active traders.
CryptoCompare Key Points
- Cost: Free.
- Mobile Application: Mobile-friendly website.
- Supported Markets: Cryptocurrencies exclusively.
- Exchange Platforms: All major exchange platforms.
- Types of Charts: Line, Candlestick, OHLC formats.
- Pros: Multiple portfolios, cross-exchange data, and real-time data.
- Cons: Mobile app is not as advanced and lacks additional compared to Trading View.
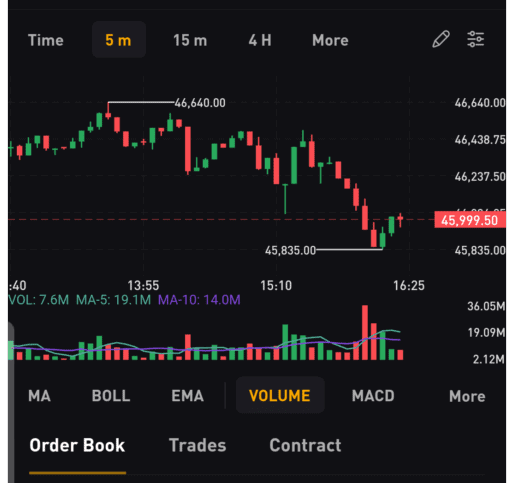
5. Binance Charts
To facilitate smooth operations, the Binance exchange provides real-time price information, along with trading volume and price trends, for every currency within the Charts. For these pairs too, candlestick, line, and depth formats, as well as other technical indicators and drawing tools for volume, price, and other calculated elements are available.
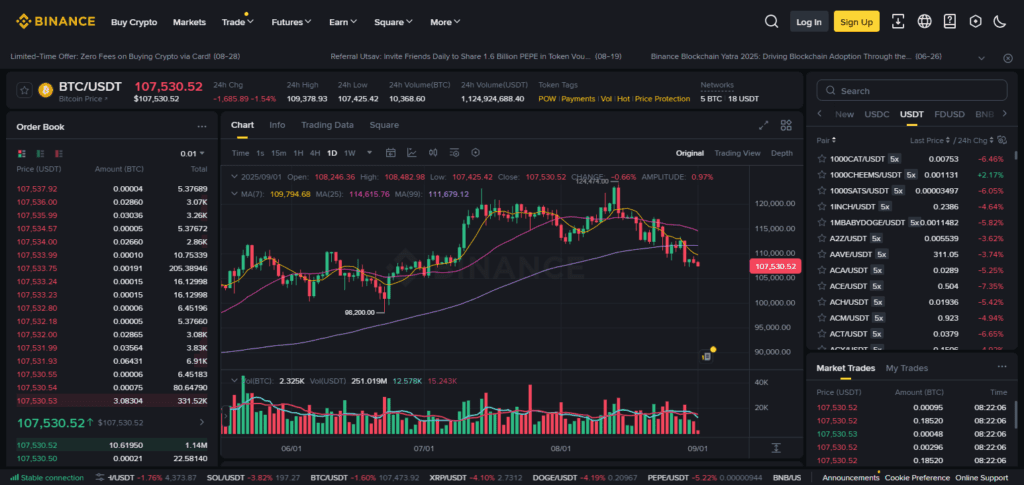
Users and traders on Binance can access the desktop and mobile apps with no restrictions. These traders conveniently access the charts and trade in real time on the pairs spanning over hundreds of markets for which the platform holds precise pricing and liquidity data.
In addition, price alerts, historical data, and order books are also available. Binance Charts, with their trading platform, historical data, order books, and price alerts, are ranked among the Best for Crypto Charts due to their extensive market coverage. They are best for both casual and professional traders.
Binance Charts Key Points
- Price: Free; registration on Binance required
- Mobile App: Android and iOS
- Markets Supported: Cryptocurrencies Only
- Exchanges Supported: Binance only
- Charts Available: Candlesticks, Line, and Depth
- Pros: Extensive analysis, real-time data, and integrated trading features
- Cons: Only Binance trading assets supported.
6. Kraken Charts
Offering more than one hundred crypto assets, Kraken Charts provides real-time precise data prices and historical trends on candlestick, line, and bar charts. Users can overlay technical analysis tools, including moving averages, RSI, and Bollinger Bands, on the charts.
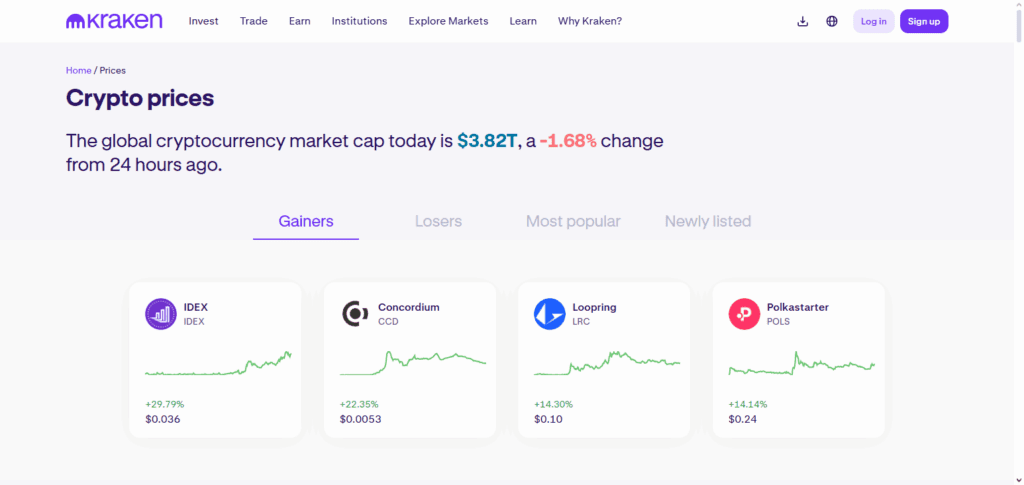
Kraken integrates charts with the exchange, enabling trading on its desktop and mobile iOS and Android apps. It supports various trading pairs, fiat, and crypto currencies. The charts include trading volume, order book depth, and historical highs and lows.
Kraken Clients enjoy the simplicity of Kraken Charts while appreciating the trustworthy data. Because of this, Kraken Charts is among the Best Crypto Charts to Use for traders all over the world.
Kraken Charts key points
- Price: Free; registration on Kraken required
- Mobile App: Android and iOS
- Markets Supported: Cryptocurrencies Only
- Exchanges Supported: Kraken Only
- Charts Available: Line, Candlestick, and Bar
- Pros: Stable data, trading, and integrated technical indicators
- Cons: Only Kraken supported coins.
7. Coinigy
Supporting more than 45 exchanges, such as Binance, Coinbase, and Kraken, Coinigy is a multifaceted exchange, cryptocurrency charting, and portfolio service. Extremely customizable, its charts offer candlestick, line, and barr charting and hundreds of technical indicators.
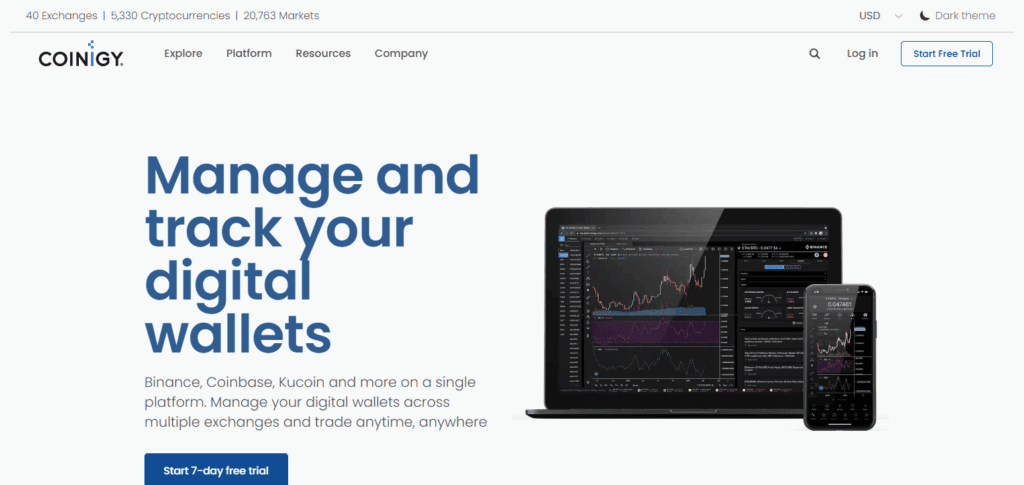
From the charts, users can trade, set and modify alert levels, and track portfolio performance. Coinigy also offers iOS and Android mobile apps, allowing users to analyze and trade charts on the move.
The platform’s charts present historical price trends, order book depth analytics, and trading volume indicators, empowering users to derive value-based decisions. Incorporating multi exchange aggregation, real-time updates, and advanced professional tools, Coinigy is undoubtedly among the Best Crypto Charts to Use.
Coinigy key Points
- Price: Subscription-based; $18.66-99.99 per month
- Mobile App: iOS and Android
- Markets Supported: Cryptocurrencies Only
- Exchanges Supported: More than 45 exchanges
- Charts Available: OHLC, Candlestick and Line
- Pros: Trading and alerts from multiple exchanges
- Cons: Expensive subscription only, and beginner unfriendly.
8. Messari
Messari Charts provides professional analytics for thousands of cryptocurrencies, covering price and market data. They include candlestick, line, and OHLC charts with associated historical trends, trading volumes, and even market capitalizations.
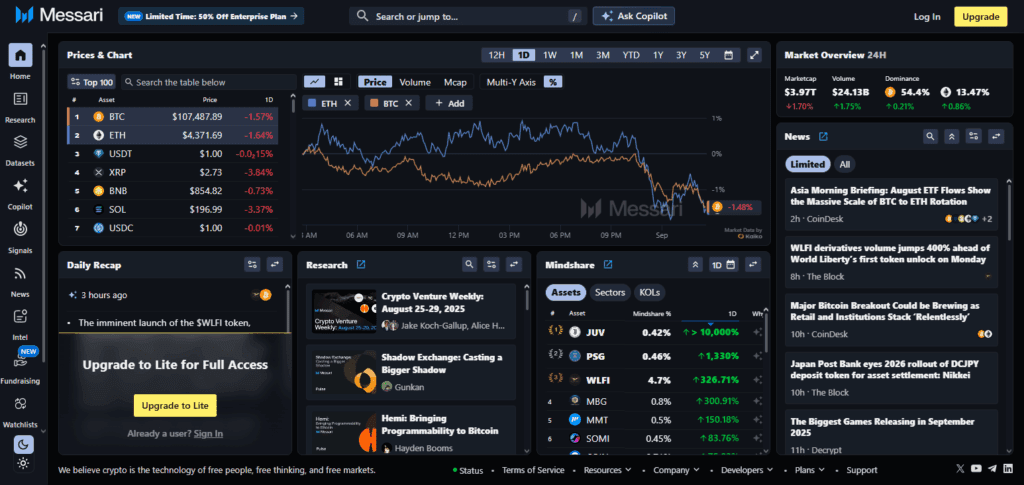
Messsari draws from several exchanges and gives users data for liquidity and pricing in real-time. Users on both web and mobile apps, on iOS and Android, can access charts, price alerts, on-chain metrics, and portfolio tracking.
It offers users additional market news and metrics, fundamental data, and other market insights to aid in research. At the other end, Messari also draws from several exchanges and gives users data for liquidity and pricing in real-time. Messari’s reliable data, advanced chart tools, and its overall coverage make Messari one of the Best Crypto Charts to Use.
Messari Key points
- Price: Free/Paid 29 – 99 per month
- Mobile App: Available on iOS and Android
- Markets Supported: Cryptocurrency only
- Exchanges Supported: 45+ Exchanges
- Charts Available: Line, Candlestick, OHLC
- Pros: Multi-exchange integration with direct trading and alerts
- Cons: Paid and complicated for beginners
9. Delta App Charts – Advancing Applications for Tracking Cryptocurrency on the Charts
Devoted to mobile cryptocurrency tracking, Delta App Charts users line, candlestick, and bar charts while receiving historical prices, volumes, and tracking portfolios in real-time. Users set alerts and market trends for thousands of coins, and the app automatically syncs portfolios from exchanges like Binance, Coinbase, Kraken, and many more.
Users can view market cap, circulating supply, and percentage changes of coins in real-time. Delta App serves market insights in mobile-friendly designs, democratizing cryptocurrency tracking. Its unrivaled interface and data precision makes Delta app one of the Best Crypto Charts to Use for mobile-centered traders and investors.
Delta App Charts key Points
- Price: Free / Paid (\$7.99/month)
- Mobile Application: IOS and Android
- Markets covered: Crypto Market Only
- Exchanges supported: More than 100 exchanges
- Chart Type: Line, Candlestick, Bar
- Advantages: Primary mobile access, real-time market alerts, portfolio access
- Disadvantages: Lacks comprehensive indicators, primarily observational
10. LiveCoinWatch
LiveCoinWatch Charts provide users with interactive candlestick, line, and bar charts for thousands of cryptocurrencies, each of which can be modified. Customers can study the historical price trends, trading volume, market capitalization, and market dominance of cryptocurrencies across multiple exchanges, including Binance, Kraken, and Coinbase.
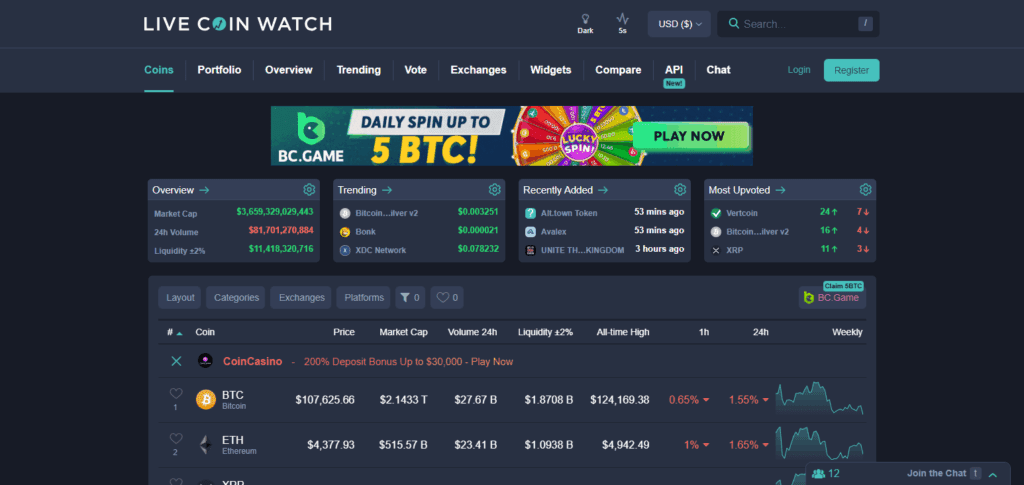
The platform is mobile friendly and supports real-time price alerts, portfolio management and market supervision. Charts are able to incorporate multiple technical analysis indicators, overlays and zoomable time spans for in-depth analysis.
The user-friendly interface, strong exchange coverage and reliable data all contribute to LiveCoinWatch being ranked among the Best Crypto Charts to Use for any level users who need precise data to the market.
LiveCoinWatch key Points
- Price: Free / Paid (\$4 -\$9/month)
- Mobile Application: IOS and Android
- Markets covered: Crypto Market Only
- Exchanges supported: Multiple global exchanges
- Chart Type: Line, Candlestick, Bar
- Advantages: Adjustable real-time portfolios, customizable graphics, and responsive charts
- Disadvantages: Lacks complex technical features that professionals would expect
How will charting tools help me become a better trader?
Charting tools play a vital role in analyzing the cusp of trading in the volatility of the cryptocurrency market. Tools that are effective in visualizing market price assistance in tracking movement, which in turn helps to form our posture entry and exit points/strategies.
Identifying Trends and Patterns: Charting tools record and analyze sequential price data to find patterns and trends. These windows in deciding the best time to place buy or sell orders, which refine short-term and long-term trading decisions.
Use of Technical Indicators: Indicators such as Moving Averages, RSI, MACD, or Bollinger Bands, which are provided by trading and analyzing tools, assist in the directional guessing of the market by signifying conditions of overbuying or overselling, trend strength and reversal points.
Crossing the Blue Ocean: Many advanced trading and analysis platforms enable traders to set alerts on price points or indicator signals, thereby maintaining their presence in the market. This, in turn, helps the traders remain updated.
The use of charting tools in trading and analyzing the market reduces emotional cusps, while cultivating a tier of discipline that helps the traders succeed.
How to analyze crypto trading and markets?
Analyzing crypto trading and markets requires the hybridization of various techniques to capture every relevant detail on the subject. A logical workflow might include the following:
Research: In this stage crypto trading experts perform fundamental analysis by practically conducting due diligence on a particular project, its gears, directive, and the way the two have functioned over a specific duration: ostiose news and the platforms of the pro body.
Market Emotion: Track the digital and news world to understand public sentiment and emotions surrounding cryptocurrency. Such turns tend to become crucial in larger moves.
Chart Examination: With the help of crypto calculators/ data physical elements, crypto traders can easily, on a proactive basis, download the RSI, MACD, and or sometimes enlighten the pattern structures.
On-Chain Data: Look at various volumes over the block and assess wallet statistics from the staking bed to derive insights over the crypto-markets.
Investment Strategy: With the array of invested time per the research devoted to the various elements, a review of the data could ensure a positive gain from the whole. Managed accounts can take a step back.
Conclusion
To sum up, the appropriate choice of crypto charts is imperative for trading and investing in cryptocurrency. TradingView, CoinGecko, CoinMarketCap, CryptoCompare, Binance, Kraken, Coinigy, Messari, Delta App, and LiveCoinWatch, for instance, provide ranges of chart types and indicators, and other market information visualization systems for traders to track price movements and market strategies.
Each platform offers specific features from mobile applications and customizable charts to multi-exchange systems in order to suit novice and professional traders. The tools, coupled with market sentiment, fundamental, technical, and on-chain analytics, can enhance a trader’s decision-making and risk management in a booming crypto market.
FAQ
Crypto charts are visual tools that display the price, volume, and market trends of cryptocurrencies over time. They help traders and investors analyze patterns, spot trends, and make informed trading decisions.
Using crypto charts allows you to track price movements, identify trends, apply technical indicators like RSI or MACD, and combine this data with fundamental and on-chain analysis to develop smarter trading strategies.
Some of the top platforms include TradingView, CoinGecko, CoinMarketCap, CryptoCompare, Binance, Kraken, Coinigy, Messari, Delta App, and LiveCoinWatch, each offering unique features, chart types, and exchange support.
Yes, most top platforms like TradingView, CoinGecko, CoinMarketCap, Binance, Kraken, Coinigy, Messari, Delta App, and LiveCoinWatch provide mobile apps for iOS and Android, enabling on-the-go chart analysis and trading.
Many crypto chart platforms offer free versions with essential features, such as CoinGecko, CoinMarketCap, and Binance. Advanced tools, indicators, and multi-exchange integration may require paid subscriptions on platforms like TradingView or Coinigy.